
A dashboard that actually looks like an exam portal.
One shortcode replaces the default LearnDash profile page with per-course scores, percentiles, streaks, an activity heatmap, and an automatic callout for the lessons a student is falling behind on.
One shortcode
Drop [lb_student_dashboard] on any page and it renders the full dashboard for the logged-in student — no page-builder assembly required.
What the dashboard actually looks like
Real screenshots from a live LearnDash site running Student Dashboard — the stats overview, the activity heatmap, and the course list a student sees.
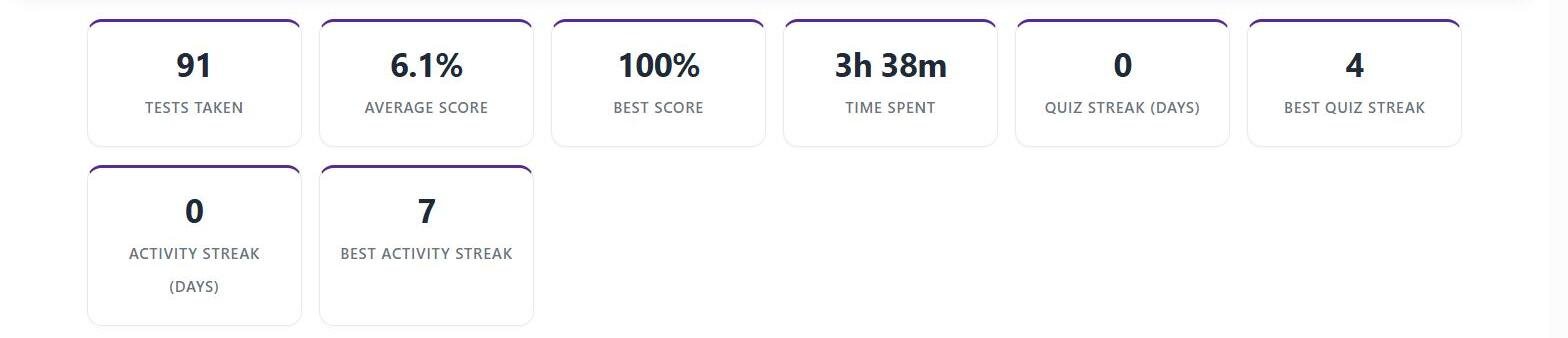
The stats overview students land on
Per-course scores, percentiles, and streaks in one shortcode — no extra plugin dashboard to configure.

The activity heatmap
A calendar view of study activity over time, so students can see their own consistency at a glance.

The course list with progress
Every enrolled course with a progress bar and a one-click Continue Course button back into LearnDash.
Everything in one shortcode
Per-course breakdowns, charts, and both LearnDash and Exam Mode attempts in a single view.
Per-course breakdown
Tests taken vs. total available, average score, total time spent, last activity date, the full list of individual past attempts, and where enabled, that course’s leaderboard.
Both plugins, one view
Reports on native LearnDash quiz attempts and Exam Mode exam attempts side by side, in the same dashboard — a student’s activity isn’t split across two different views depending on which plugin generated it.
Score charts
Score distribution and trend charts rendered with Chart.js, loaded from a CDN.
Drop-in replacement
Most sites use it to replace the default LearnDash profile page, but you can also add it as a separate “My Results” page and keep both.
Built to keep students coming back
Streaks, heatmaps, and an automatic callout for the lessons a student is falling behind on.
Two streak counters
Two separate streak counters — one for quiz-taking activity and one for overall site activity — tracked independently so a student can see both at a glance.
Activity heatmap
A GitHub-style activity heatmap showing activity density over time, built from the student’s own attempt and activity timestamps.
Automatic weak-lesson callout
Any lesson where the student’s average score across that lesson’s quizzes falls under 60% is flagged automatically, computed on the fly — no manual tagging of lessons or questions by category required.
Optional leaderboard
Optional per-course leaderboard ranking students against their classmates on that course.
Built for real traffic
Pre-aggregated data and a REST API so the dashboard stays fast as attempt history grows.
Pre-aggregated data
Dashboard data is pre-aggregated on an hourly WP-Cron job rather than computed live on every page load, so the dashboard stays fast even on sites with a large question and attempt history.
REST API included
A REST API sits behind the same data layer as the on-site dashboard, so the same scores, streaks, and breakdowns are available to build a mobile app or other external client against, not just the WordPress front end.
Requires LearnDash
Requires LearnDash to be active — Student Dashboard reads directly from LearnDash’s own quiz and course data, plus Exam Mode’s attempt data where that plugin is also installed.
Frequently asked questions
Does this replace the default LearnDash profile page, or run alongside it?
It’s a shortcode you place on whichever page you want — most sites use it to replace the default LearnDash profile page, but you can also add it as a separate “My Results” page and keep both.
How is a “weak lesson” decided?
Automatically: any lesson where a student’s average score across that lesson’s own quizzes is below 60% is flagged. There’s no manual setup or per-question tagging involved.
Does it show Exam Mode attempts as well as regular LearnDash quiz attempts?
Yes — both feed the same dashboard, so a student’s activity is reported in one place regardless of which plugin generated a given attempt.
Will this slow down my site as attempt history grows?
The heavier calculations (course averages, leaderboards, streaks) are rebuilt hourly in the background rather than recalculated on every page view, so dashboard load times don’t scale with your full attempt history.
Questions before you buy?
Email us or reach out through the contact page — happy to talk through whether Student Dashboard fits your course setup.